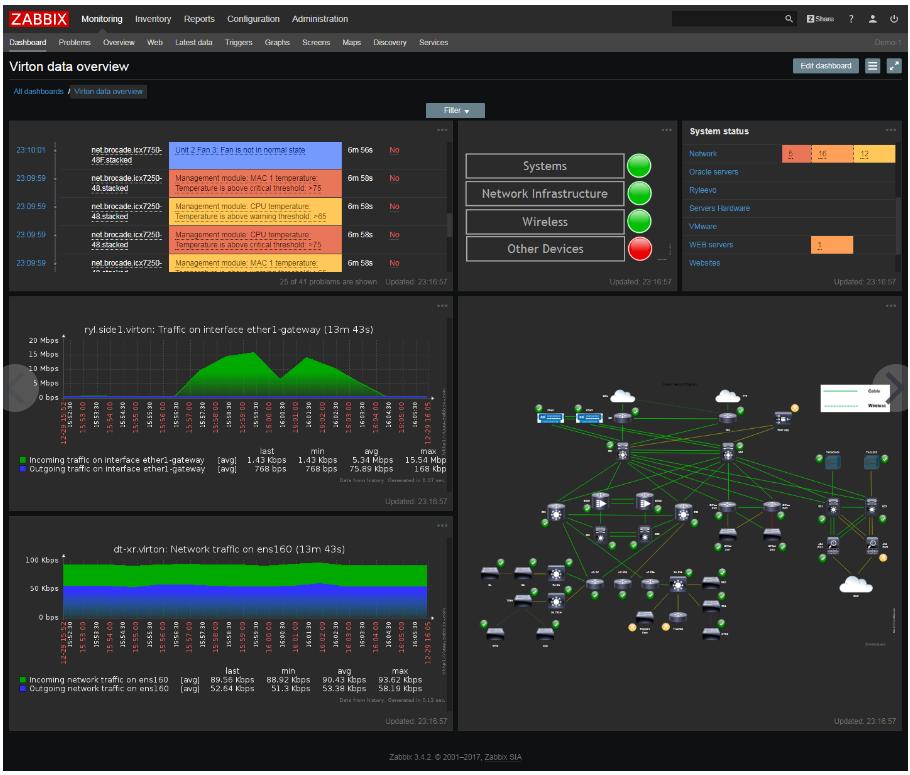
Zabbix Network Monitoring tackle performance and incidents in your network
 Network Performance
- Network bandwidth usage
- Packet loss rate
- Interface error rate
- High CPU or memory utilization
- Abnomaly high connections detection
- Aggregate throughput of core routers is low
- DDoS detection and alert
VPN
- Link is down
- System status is in warning/critical state
- Device temperature is too high / too low
- Power supply is in critical state
- Free disk space is low
- Fan is in critical state
- No SNMP data collection
Intrusion Prevention System
- New device added or removed
- Network module is added, removed or replaced
- Firmware has been upgraded
- Device serial number has changed
- Interface has changed to lower speed or half-duplex mode
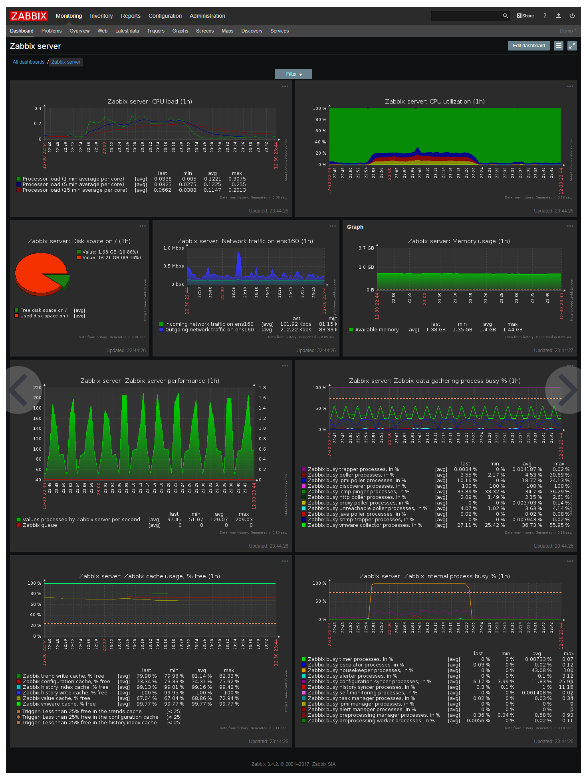
Key features and benefits
Metric collection
|
Various metric collection methods and protocols
Autodiscovery
|
Flexible and extendable data gathering
-
Calculated and aggregated metrics. For example: sum of traffic between two ports on a network switch.
-
Preprocess collected data. For example: use regexp to extract some specific metric from legacy device.
Templating
- Start to monitor all metrics instantly by using out-of-the-box templates
- Clone and mass-update thousands of similar network devices using device configuration templates
|
Problem detection
|
Flexible problem definition
Problem dependencies
- Define multi-level dependencies between related network nodes. Detect root cause failures.
|
Proactive network monitoring
-
Predict network downtimes
- Predict trends of bandwidth usage
- Detect anomalies in network load
Problem severity levels
- Define trigger severity levels to help concentrate on most important problems in case of multiple network issues.
|
|
Notification

|
Flexible notifications
- Multiple delivery methods: email, sms, jabber, custom scripts or messenger
-
Customize message content based on recipient and escalation history
Event correlation
Decrease notification noise with event correlation
|
Remediation
- Run remote scripts on monitored device. You can restart remote switch, or reset/reconfigure network interface.
- Run remote commands even behind firewalls
Customized escalation scenarios
- Build flexible escalation scenarios
- Escalate to user groups
|
|
Zabbix API

|
Integration with 3rd party software
- Helpdesks, ticketing systems (2-way integration)
- Configuration management systems
- Messengers, mobile applications
- Inventory systems
|
|
|
Distributed monitoring

|
Unlimited scalability
- Scale by offloading Zabbix server using Zabbix proxy
- Zabbix has no limits or hidden restrictions. Whatever the network size is.
Security and authentication
-
Encrypt all monitoring traffic between Zabbix and your network devices
- Use LDAP authentication and flexible user permissions
|
Optimized for high performance
- Code efficiency, loadable modules...
- Data caching...
High Availability
- Use Zabbix proxy to collect monitoring data in case of network issues
- Build redundant monitoring solution using Zabbix components. See example.
|